People often get confused between Monitoring and Observability and use them interchangeably in the DevOps field. But they are two very unique concepts. Since we work in this sphere, I thought it was ideal to clear up this confusion and give you the right information on it.
人们经常混淆监控和可观测性,并在 DevOps 领域将它们混着使用。但它们是两个非常独特的概念。
With most of the application software now adopting several microservices and going for distributed architecture, the need to have a complete overview of your system cannot be understated. This is where the terms “Monitoring” and “Observability” come into play.
如今,大多数应用软件都采用多个微服务并采用分布式架构,因此获取对系统全面了解的需求不容小觑。这就是“监控”和“可观测性”这两个术语发挥作用的地方。
- 什么是监控?(What is Monitoring?)
- 为什么在现在这个时代单靠监控是不足够的?(Why is Monitoring alone Insufficient in this Modern era?)
- 什么是可观测性?(What is Observability?)
- 可观测性的三大支柱(Three Pillars of Observability)
- 可观测性与监控:有什么区别?(Observability vs. Monitoring: What's the difference?)
- 可观测性与监控:有何相似之处?(Observability vs. Monitoring: What are the Similarities?)
- 监控与可观测性:对比(Monitoring vs. Observability: Comparison)
- 监控和可观测性:哪个更好?(Monitoring and Observability: Which is Better?)
- 相关术语(Related Terms)
Monitoring is the process of collecting data from an application. It involves monitoring several components of your system, such as application metrics or assessing CPU usage, network traffic, or application response times.
监控是从应用程序收集数据的过程。它涉及监控系统的多个组件,例如应用指标或评估 CPU 使用率、网络流量或应用响应时间。
In simpler words, monitoring is what you do when you instrument your application or hardware to collect some data. The output of such a collection would be quantifiable values on how different aspects of your application or features are performing. For example, if you’re monitoring your infrastructure, then you would want to look into the condition of your host CPU, memory usage, I/O wait time, etc.
简单来说,监控就是我们对应用程序或硬件进行检测以收集一些数据。收集的输出结果将是应用或功能不同方面执行情况的可量化值。例如,如果我们正在监控基础设施,那么就需要查看主机 CPU、内存使用情况、I/O 等待时间等的状况。
DevOps monitoring covers the full software development lifecycle. It is closely linked with other IT service management (ITSM) functions including incident management, availability, capacity, and performance management.
DevOps 监控涵盖整个软件开发生命周期。它与其他IT 服务管理(ITSM) 功能紧密相关,包括事件管理、可用性、容量和性能管理。
Monitoring is a very generic term and it can be further divided into the following(监控是一个非常通用的术语,它可以进一步分为以下几类):
- 基础设施监控(Infrastructure Monitoring)
- 应用程序性能监控(Application Performance Monitoring)
- 网络监控(Network Monitoring)
- 综合和真实用户监控(Synthetic and Real User Monitoring)
- 云监控(Cloud Monitoring)
- 容器监控(Container Monitoring)
- 数据库监控(Database Monitoring)
- 安全健康(Security Monitoring)
Monitoring is generally bound by time, i.e., metrics are always calculated over a predefined time period because only then can we analyze and find trends, anomalies and other potential issues.
监控通常受时间的约束,即指标总是在预定义的时间段内计算,因为只有这样我们才能分析并发现趋势、异常和其他潜在问题。
Monitoring Quick Bytes(监控快速说明)
- 实时监控系统健康和指标(Keep real-time oversight of system health and metrics)。
- 收集指标涉及那些直接影响应用程序性能的指标(Collection metrics involves those that directly affect the performance of applications)。
- 当超过设置的阈值时,就会发出警报。我们可以根据使用场景设置这些告警阈值(Alerts go off when the set threshold limit is breached. You can set these limits according to use case)。
- 让我们能够尽早识别错误原因。这样我们就可以在问题升级之前密切关注它们(Allows you to identify the cause of error quite early on. So you can keep an eye on them before the issue escalates)。
- 优化系统性能时,请使用这些指标(Optimize system performance, keeping these metrics in mind)。
A monitoring setup's primary goal is to ensure maximum availability and uptime, that the application is available for as long as feasible.
监控设置的主要目标是确保最大可用性和正常运行时间,即应用程序尽可能长时间可用。
Two key metrics to quantify an application's reliability are Time to Detect (TTD) and Time to Mitigate (TTM). TTD is used to determine how quickly bugs in an application are reported to the appropriate team.
量化应用程序可靠性的两个关键指标是检测时间 (Time to Detect,TTD) 和缓解时间(Time to Mitigate,TTM)。TTD 用于确定应用程序中的错误报告给相应团队的速度。
TTM indicates how quickly the team can respond to an issue and restore normalcy. While the TTM metric is dependent on the issue as well as the DevOps team's capabilities, a robust monitoring setup may assure good TTD values, reducing the amount of time it takes to complete the process.
TTM 表示团队响应问题并恢复正常状态的速度。虽然 TTM 指标取决于问题本身以及 DevOps 团队的能力,但强大的监控系统可以确保良好的 TTD 值,从而减少完成流程所需的时间。
Product teams can benefit greatly from application usage statistics. While a user can post a descriptive review of your app whenever they want, their usage statistics may give you a better idea of how well they've been able to use it.
产品团队可以从应用使用情况统计中受益匪浅。虽然用户可以随时发布对您应用的评价,但他们的使用情况统计可能会让我们更好地了解他们使用该应用的情况。
Similarly, by examining changes in usage statistics, monitoring tools can be made smart enough to validate changes in performance across various deployments. If an update results in a reduced usage trend in the feature addressed by the update, this is an obvious red flag that the product team should address.
同样,通过检查使用情况统计的变化,监控系统可以变得足够智能,以验证各种部署中的性能变化。如果更新导致相关功能的使用趋势下降,那么这是一个明显的危险信号,产品团队应该解决。
Technology space has evolved and is teeming with up-and-coming solutions that cater to even the most atypical problems. At this time, if we rely only on Monitoring, we are losing out on so many things.
技术领域不断发展,涌现出大量新兴解决方案,除了解决常规问题之外,也可解决很多罕见的问题。目前,如果我们仅依赖监控,就会错失很多机会。
请考虑以下情况(Consider these cases):
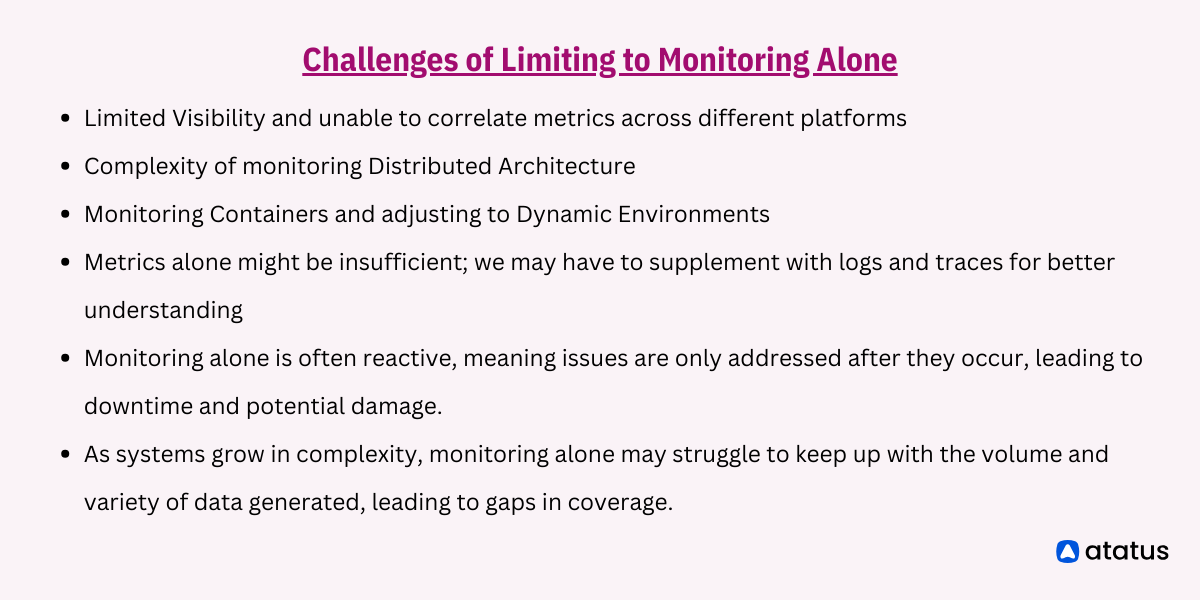
监控系统遇到的挑战(Challenges encountered with Monitoring)
The first big problem comes with correlating metrics collected from one product with another on the same stack. If you can’t compare the data across different platforms, how are you going to see its effects on the related components. Imagine a web application that's experiencing intermittent slowdowns during peak usage hours. Monitoring metrics like CPU usage and network traffic might show spikes during these periods, indicating a potential issue. However, without additional context from logs or traces, it's challenging to pinpoint the exact cause.
第一个大问题在于将从一个产品收集的指标与同一堆栈上的另一个产品收集的指标关联起来。如果我们无法比较不同平台上的数据,那么我们将如何看到它对相关组件的影响。想象一下,一个 Web 应用在使用高峰时段出现间歇性 QPS 下降。CPU 使用率和网络流量等指标可能会在这些时段出现峰值,这表明存在潜在问题。但是,如果没有来自日志或追踪的其他上下文,很难确定确切的原因。
Since most of the applications are now made of distributed microservices, we need to ensure proper communication between these. For example, if an e-commerce platform suddenly experiences errors in its checkout process, monitoring is of not much help here. But if you had the option of request tracing, you could have identified the origin of this error.
由于现在大多数应用都是由分布式微服务组成的,因此我们需要确保这些微服务之间进行正确通信。例如,如果一个电子商务平台在结账过程中突然出现错误,监控在这里就没什么用了。但如果我们可以选择请求跟踪,就可以确定此错误的来源。
Consider this scenario of an organization frequently updating its containerized applications running on a Kubernetes cluster. Monitoring tools track resource utilization metrics like CPU and memory usage, but they don't automatically adjust their monitoring configurations when new containers are deployed or scaled up/down. As a result, the operations team may miss critical performance issues or resource constraints in newly deployed containers.
设想这样一个场景:一个组织频繁更新在 Kubernetes 集群上运行的容器化应用。监控系统会跟踪 CPU 和内存使用率等资源利用率指标,但在部署或扩容/缩容新容器时,它们不会自动调整监控配置。因此,运维团队可能会错过新部署容器中的关键性能问题或资源限制。
For example, take a financial services company whose trading platform experiences intermittent outages during peak trading hours. Monitoring tools generate alerts when the platform becomes unavailable, but the operations team struggles to diagnose the underlying cause. Without access to detailed transaction logs or request traces, they can't determine whether the outages are due to a database deadlock, network latency issues, or third-party API failures.
例如,一家金融服务公司的交易平台在交易高峰期会间歇性中断。当平台不可用时,监控系统会生成警报,但运维团队很难诊断出根本原因。由于无法访问详细的交易日志或请求追踪,他们无法确定中断是由于数据库死锁、网络延迟问题还是第三方 API 故障造成的。
These examples demonstrate how observability complements monitoring by providing richer insights and context, enabling organizations to better understand and troubleshoot issues in modern IT environments.
这些示例说明了可观测性如何通过提供更丰富的洞察和上下文来补充监控数据,使组织能够更好地理解和解决现代 IT 环境中的问题。
“没有监控就不可能有可观测性。”(“Observability wouldn’t be possible without monitoring.”)
Observability expands upon the concept of monitoring by emphasizing a deeper understanding of system behavior through comprehensive data collection, analysis, and contextual insights. While monitoring primarily focuses on predefined metrics and thresholds, observability seeks to provide visibility into the internal workings of complex systems, enabling organizations to answer questions about why things are happening the way they are.
可观测性扩展了监控的概念,强调通过全面的数据收集、分析和情境洞察来更深入地了解系统的行为。监控主要侧重于预定义的指标和阈值,而可观测性则旨在提供对复杂系统内部运作的可见性,使组织能够回答有关问题发生的根因。
Observability is important because it gives you performance-focused insights, more control, and is crucial for understanding complex IT systems. It provides performance insights, more control, and helps diagnose issues quickly. With comprehensive data analysis, it provides valuable insights to improve system performance and reduce downtime and understanding of complex modern IT systems.
可观测性很重要,因为它可以为我们提供以性能为中心的见解、更多控制权,并且对于理解复杂的 IT 系统至关重要。它提供性能洞察、更多控制权,并有助于快速诊断问题。通过全面的数据分析,它提供了有价值的洞察,以提高系统性能、减少停机时间并了解复杂的现代 IT 系统。
可观测性简要介绍(Observability Quick Bytes):
- 数据收集不仅限于指标,还包括日志、追踪和事件(Data collection goes beyond metrics. Logs, traces, and events are included)。
- 关联来自不同来源的数据并提供系统内发生情况的完整视图(Correlates data from diverse sources and provides a complete picture of what’s happening in your system)。
- 高效分析自发误差的根本原因(Highly efficient in analyzing root causes of spontaneous errors)。
- 提供持续监控和定期警报,以确保应用持续更新且无错误(Offers continuous monitoring and regular alerting to keep applications updated and error free)。
- 分析趋势并做出必要的改变,这也有助于主动管理(Analyze trends and make necessary changes, also helpful for proactive management)。
When we talk of observability, three pillars basically capture the entire essence of it. These are logs, metrics and traces. 当我们谈论可观测性时,三大支柱基本上概括了它的全部本质。它们是日志、指标和追踪。
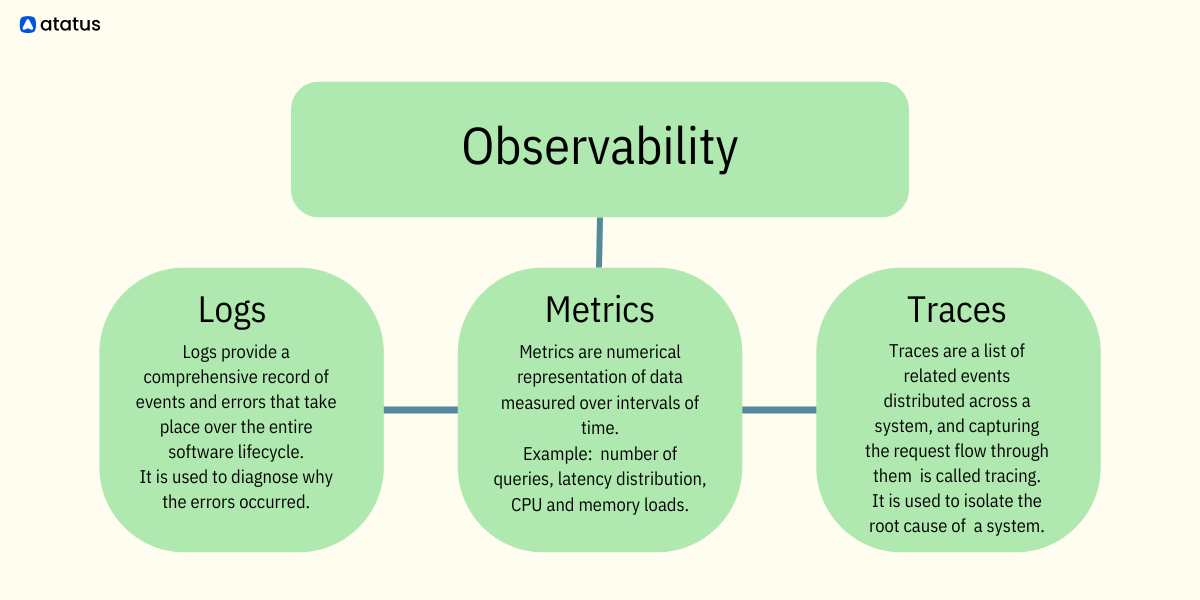
Three Pillars of Observability
可观测性的三大支柱
Logs consist of detailed records of events, activities, and transactions occurring within a system. They capture valuable information such as user interactions, system errors, application events, and infrastructure changes. Logs serve as a chronological record of system activity, enabling developers and operators to troubleshoot issues, trace the root cause of problems, and gain visibility into the inner workings of the system.
日志包含系统内发生的事件、活动和事务的详细记录。它们捕获有价值的信息,例如用户交互、系统错误、应用程序事件和基础架构更改。日志按时间顺序记录系统活动,使开发人员和运维员能够排查问题、追踪问题的根本原因并了解系统的内部工作原理。
Metrics are quantitative measurements that track the performance and behavior of a system over time. These measurements include key performance indicators (KPIs), such as response times, error rates, and resource utilization. Metrics help identify deviations from expected behavior. Metrics are quantifiable data of how a system or software works. This can include response time, error rates, throughput, and resource utilization. Metrics help in understanding the overall health and efficiency of a system by providing objective indicators of its performance.
指标是跟踪系统随时间变化的性能和行为的定量测量。这些测量包括关键性能指标 (KPI),例如响应时间、错误率和资源利用率。指标有助于识别与预期行为的偏差。指标是系统或软件如何工作的可量化数据。这可以包括响应时间、错误率、吞吐量和资源利用率。指标通过提供系统性能的客观指标,帮助了解系统的整体运行状况和效率。
Tracing involves following the flow of requests or transactions as they traverse through a distributed system. Traces provide visibility into the end-to-end journey of a request, highlighting dependencies, latency, and potential bottlenecks. By correlating traces with logs and metrics, organizations can gain a holistic understanding of system interactions and diagnose complex issues more effectively.
追踪涉及追踪请求或事务在分布式系统中的执行流程。追踪可让我们了解请求的端到端过程,突出显示依赖项、延迟和潜在瓶颈。通过将追踪与日志和指标关联起来,组织可以全面了解系统交互并更有效地诊断复杂问题。
While monitoring and observability share the common goal of ensuring the reliability and performance of systems, they differ in their approach and scope.
虽然监控和可观测性具有确保系统可靠性和高性能的共同目标,但它们的方法和范围有所不同。
Monitoring relies on predefined metrics and thresholds to track system health and detect deviations from expected behavior, whereas observability goes beyond this by providing a more comprehensive view of system behavior through the collection of diverse, contextual data. Monitoring is well-suited for detecting known issues or patterns based on predefined metrics, while observability excels in uncovering insights and diagnosing issues that may not be captured by traditional monitoring alone.
监控依靠预定义的指标和阈值来跟踪系统运行状况并检测与预期行为的偏差,而可观测性则通过收集各种上下文数据来提供更全面的系统行为视图,从而超越了监控。监控非常适合根据预定义的指标检测已知问题或模式,而可观测性则擅长发现洞察和诊断传统监控本身可能无法捕获的问题。
Both Monitoring and Observability aim to inform about system health and behaviour. While monitoring focuses on the metrics alone, observability goes a step further and includes details about where these metrics occurred and how they affect other components of the system.
监控和可观测性都旨在告知系统健康和行为。监控仅关注指标,而可观测性更进一步,包括这些指标发生的位置以及它们如何影响系统的其他组件的详细信息。
They aim to generate insights into system health, performance, and reliability, aiding in issue detection and operational support. By integrating both practices, organizations can achieve a comprehensive approach to system management, ensuring operational excellence and addressing a wide range of operational challenges effectively.
它们旨在深入了解系统健康状况、性能和可靠性,帮助检测问题并提供运维支持。通过整合这两种实践,组织可以实现全面的系统管理方法,确保卓越运营并有效应对各种运营挑战。
| 对比项(Aspect) | 监控(Monitoring) | 可观测性(Observability) |
|---|---|---|
| 聚焦(Focus) | 跟踪预定义的指标和阈值(Tracks predefined metrics and thresholds)。 | 提供对系统行为及其发生原因的见解(Provides insights into system behavior and why it occurs)。 |
| 数据收集(Data Collection) | 收集特定指标(CPU、内存等)(Collects specific metrics (CPU, memory, etc.))。 | 收集各种数据(指标、日志、追踪、事件)(Gathers diverse data (metrics, logs, traces, events))。 |
| 洞察深度(Depth of Insights) | 提供有关系统健康状况的表面层次见解(Offers surface-level insights into system health)。 | 通过上下文理解提供深刻见解(Provides deep insights with contextual understanding)。 |
| 被动与主动(Reactive vs Proactive) | 被动响应;根据预定义的阈值触发警报(Reactive; alerts triggered based on predefined thresholds)。 | 主动发现;能够了解系统行为以防止出现问题(Proactive; enables understanding of system behavior to prevent issues)。 |
| 复杂性处理(Complexity Handling) | 处理简单的指标监控(Handles simple metrics monitoring)。 | 有效地处理复杂的分布式架构(Handles complex distributed architectures effectively)。 |
| 根本原因分析(Root Cause Analysis) | 找出问题根本原因的能力有限(Limited ability to pinpoint root causes of issues)。 | 利用全面的数据更容易做根本原因分析(Facilitates root cause analysis with comprehensive data)。 |
| 可用性(Adaptability) | 可能难以适应动态环境(May struggle to adapt to dynamic environments)。 | 能很好地适应系统架构和规模的变化(Adapts well to changes in system architecture and scale)。 |
| 案例(Use Cases) | 基本系统健康监测(Basic system health monitoring)。 | 故障排除、调试、性能优化(Troubleshooting, debugging, performance optimization)。 |
Having read this far, you might have doubts as to what to implement and which is better?
读到这里,大家可能会产生疑问,到底该实现什么以及哪个更好?
Typically, monitoring offers a condensed picture of the system data that is centered on specific metrics. When system failure modes are well understood, this strategy is enough.
通常,监控会提供以特定指标为中心的系统数据的简明概述。当系统故障模式得到充分理解时,此策略就足够了。
Monitoring indicates system performance because it concentrates on important metrics like utilization rates and throughput. For example, you might want to keep track of any latency when writing data to the disk or the typical query response time when monitoring a database. Database administrators with experience can recognize patterns that may indicate recurring issues.
监控可以反映系统性能,因为它专注于利用率和吞吐量等重要指标。例如,我们可能希望跟踪任何数据写入磁盘时的延迟,或监控数据库典型查询响应时间。经验丰富的数据库管理员可以识别可能表明重复出现问题的模式。
Examples include a rise in CPU usage, a decline in the cache hit ratio, or a surge in memory usage. These problems can be a sign of a badly worded query that needs to be stopped and looked at.
例如 CPU 使用率上升、缓存命中率下降或内存使用率激增。这些问题可能表明查询语句不当,需要停止并做检查。
However, when compared to troubleshooting microservice systems with several components and a variety of dependencies, conventional database performance analysis is simple. Understanding system failure modes are useful for monitoring, but as applications become more complicated, so do their failure modes. Often, the way that distributed applications will fail cannot be predicted.
然而,与对具有多个组件和各种依赖项的微服务系统进行故障排除相比,传统的数据库性能分析很简单。了解系统故障模式对于监控很有用,但随着应用程序变得越来越复杂,其故障模式也变得越来越复杂。通常,分布式应用程序的故障方式是无法预测的。
Making a system observable allows you to comprehend its internal state and, from there, identify what is malfunctioning and why.
系统可观测可以让我们了解它系统的内部状态,从而找出故障发生的地方和发生的原因。
However, in contemporary applications, correlations between a few metrics are frequently insufficient to diagnose events. Instead, these contemporary, complicated applications demand a greater level of system state visibility, which you can achieve by combining observability with more potent monitoring tools.
然而,在现代应用中,一些指标之间的相关性通常不足以诊断事件。相反,这些复杂的应用程序需要更高级别的系统状态可见性,我们可以通过将可观测性与更强大的监控系统相结合来实现这一点。
- 应用程序架构相对简单,具有可预测的故障模式(Your application architecture is relatively simple, with predictable failure modes)。
- 需要监控特定指标来跟踪系统性能和健康状况(You need to monitor specific metrics to track system performance and health)。
- 希望根据预定义的指标来识别趋势、异常和性能瓶颈(You want to identify trends, anomalies, and performance bottlenecks based on predefined metrics)。
- 我们在一个具有众多相互连接的组件和依赖关系的复杂分布式环境中进行操作(You operate in a complex, distributed environment with numerous interconnected components and dependencies)。
- 故障模式是不可预测的,传统监控可能无法提供足够的见解(Failure modes are unpredictable, and traditional monitoring may not provide sufficient insights)。
- 需要更深入地了解每个组件的内部状态和行为,才能有效地诊断问题(You need deeper visibility into the internal state and behavior of each component to diagnose issues effectively)。
- 想关联来自不同平台的指标并查看它们如何反映每个组件的性能(You want to correlate metrics from different platforms and see how they reflect in each components performance)。
Some terms related to Observability and Monitoring include:
与可观测性和监控相关的一些术语包括:
Telemetry is the process of collecting raw data from a system and passing it onto a monitoring solution. This data often includes information about the performance, behavior, and status of various components within a system or network.
遥测是从系统收集原始数据并将其传递到监控系统的过程。这些数据通常包括有关系统或网络内各个组件的性能、行为和状态的信息。
Telemetric data on its own is of no use; only when a monitoring or observability tool analyzes it does it provide value to the user.
遥测数据本身是没有用的;只有当监控或可观测性工具对其进行分析时,它才能为用户提供价值。
APM is a subset of both Monitoring and Observability. There are several types of monitoring, one of which is APM. APM focuses only on what happens within an application (for example, if you have an APM tool, it will not assess whether your servers are running properly!).
APM 是监控和可观测性的子集。监控有多种类型,其中一种就是 APM。APM 仅关注应用程序内部发生的事情(例如,如果您有 APM 工具,它不会评估您的服务器是否正常运行!)。
It monitors application-specific metrics, such as response times, transaction throughput, error rates, database queries, and user session metrics, which are closely related to making better user experiences.
它监控特定于应用程序的指标,例如响应时间、事务吞吐量、错误率、数据库查询和用户会话指标,这些指标与提供更好的用户体验密切相关。
在此了解有关应用程序性能监控的更多信息(Learn more about Application Performance Monitoring here)。
Logs monitoring involves the systematic tracking and analysis of logs generated by various systems, applications, networks, and devices within an organization's IT infrastructure. Logs contain all details about any event happening within your system - be it errors, crashes, malware or other security breaches. Log data is then aggregated into a centralized repository or database where it can be easily accessed and analyzed. This aggregation helps in correlating data from different sources and identifying patterns or anomalies.
日志监控涉及对组织 IT 基础设施内各种系统、应用程序、网络和设备生成的日志进行系统跟踪和分析。日志包含系统内发生的任何事件的所有详细信息 - 无论是错误、崩溃、恶意软件还是其他安全漏洞。然后,日志数据被聚合到一个集中存储库或数据库中,在那里可以轻松访问和分析。这种聚合有助于关联来自不同来源的数据并识别模式或异常。
Logs Monitoring typically follows this pattern:
日志监控通常遵循以下模式:
Collection > Aggregation > Analysis > Alerting > Reporting
收集 > 聚合 > 分析 > 警报 > 报告
Visualizing log data makes it easier to comprehend the overall system performance and you can easily identify what to tweak and where. That is why Logs Monitoring solutions with an inclusive visualization capability are a big hit among developers.
可视化日志数据可以更轻松地了解整体系统性能,并且我们可以轻松确定需要调整的内容和位置。这就是具有全面可视化功能的日志监控解决方案在开发人员中大受欢迎的原因。