Hey @mrhelmus and @fkeck
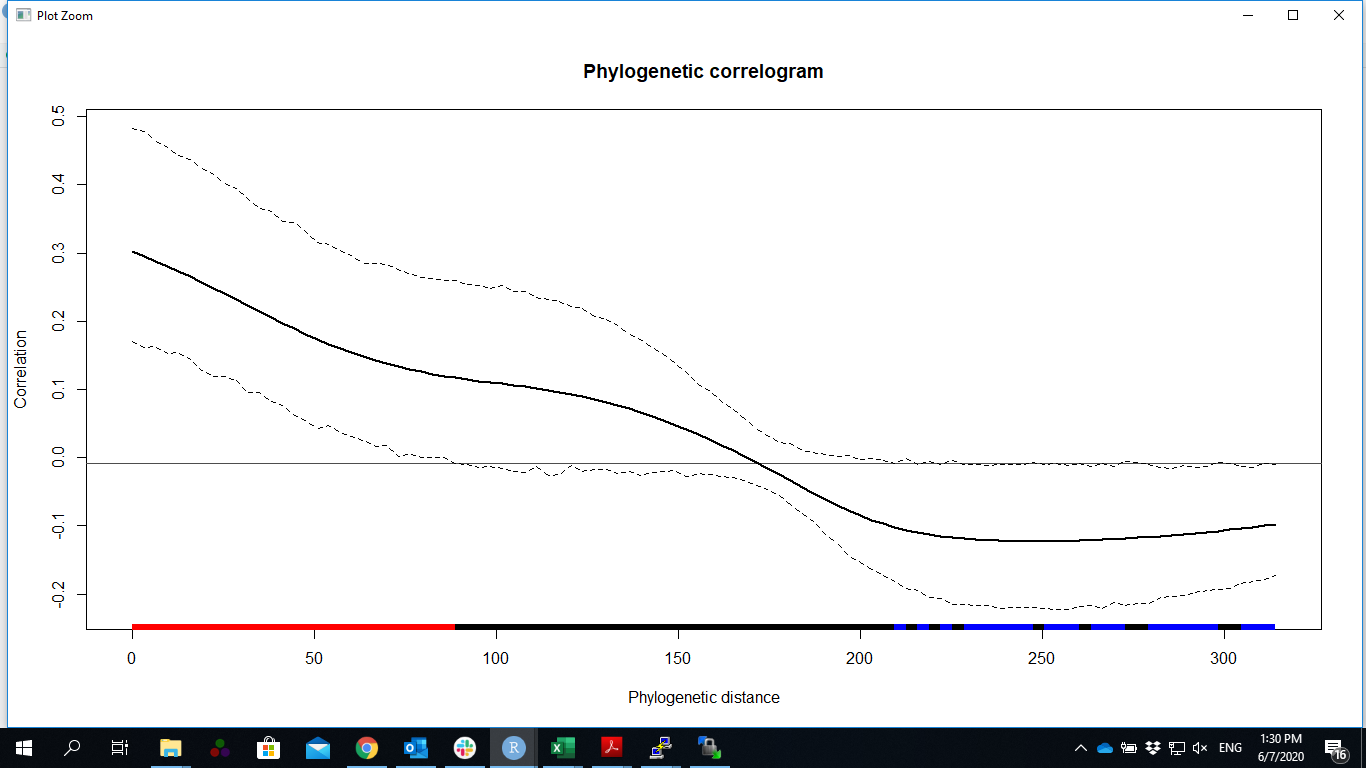
I wanted to ask if I want to explain my Phylocorrelogram() results, by mentioning that positive correlation (shown in red) is for certain tips, while negative correlation (shown in blue) is for other tips. Then how do I do that?
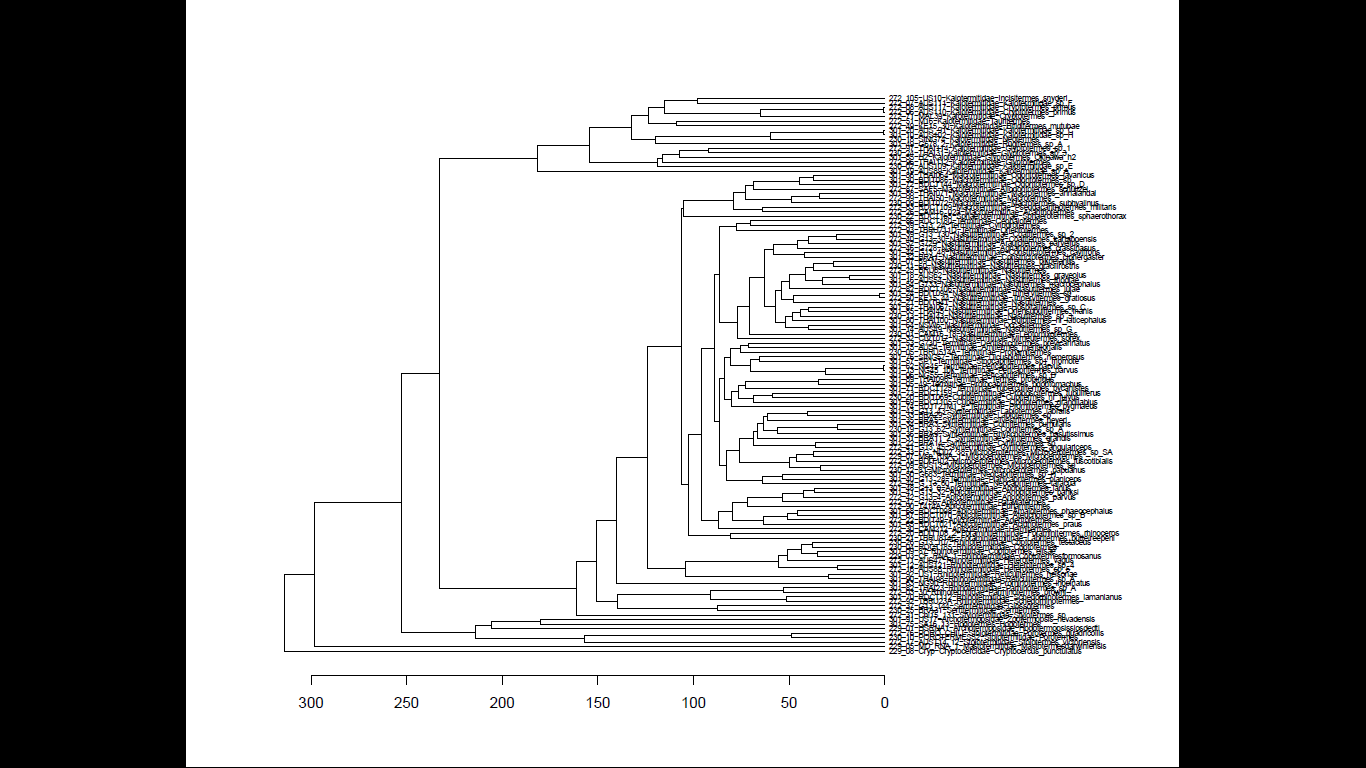
I tried plotting the hclust() of the patristic distance of the tree, which gives me the second image, but I am missing something here. How do I combine both the information to get tips that show positive autocorrelation and those that show negative autocorrelation?
I have the following correlogram plot, and want to get the corresponding tips to explain the above mentioned analysis, is it possible?
Hey @mrhelmus and @fkeck
I wanted to ask if I want to explain my Phylocorrelogram() results, by mentioning that positive correlation (shown in red) is for certain tips, while negative correlation (shown in blue) is for other tips. Then how do I do that?
I tried plotting the hclust() of the patristic distance of the tree, which gives me the second image, but I am missing something here. How do I combine both the information to get tips that show positive autocorrelation and those that show negative autocorrelation?
I have the following correlogram plot, and want to get the corresponding tips to explain the above mentioned analysis, is it possible?