A Power BI dashboard project built with
.pbipstructure for version control and collaboration.
Video Demo:
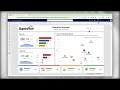
Watch demo video (59 seconds)
This project delivers executive-level insights into quarterly sales performance, designed to support data-driven decision-making across key business dimensions, including regional performance, product categories, customer segmentation, and financial strategy.
The underlying dataset is the well-known Superstore dataset, a fictional retail company's transactional sales data. It covers revenue, quantity, profit, and shipping across multiple regions, categories, and customer segments.
You can find the dataset on platforms like Kaggle
| Field | Value |
|---|---|
| Report Name | superstore_dashboard_project |
| Current Version | v1.0.0 |
| Status | Published |
Executive Overview — Quarterly Sales Performance

Regional Sales — West Region Breakdown

| # | Page | Purpose |
|---|---|---|
| 1 | Executive Overview | Top-level KPIs: total sales, profit, and a Sales × Profitability matrix across segments and categories |
| 2 | Regional Breakdown | Drill-down by region — sales, profit, order count, AOV, and top cities |
Other pages (not included in v1.0.0) will cover: - Product category performance - Customer segmentation analysis - Strategic & financial insights (margin analysis, growth trends, etc.)
- Quarter — Filter all pages by quarter (e.g.
2026-Q3) - Country/Market — Filter by geography (e.g.
USorCA) - Region — Available on the Regional Sales page (e.g.
West,East,Central,South)
The project uses the Superstore dataset. A flat, single-table CSV source containing transactional sales records for a fictional US-based retail company.
| Field Group | Examples |
|---|---|
| Order info | Order ID, Order Date, Ship Date, Ship Mode |
| Geography | Region, State, City |
| Product | Category, Sub-Category, Product Name |
| Financials | Sales, Quantity, Discount, Profit |
| Customer | Customer ID, Customer Name, Segment |
As the source is a single flat table, no complex relational model was designed. Data is imported directly into Power BI with minimal transformation — the primary addition being a dedicated Date dimension for time-based analysis.
Sales— Core transactional table containing revenue, quantity, discount, and profit at the order-line level.
Date— Generated date dimension enabling quarter, month, and year slicing.
All DAX measures are defined in: DAX Measures
The visual theme is defined in Superstore_Theme_Jandaghian_final.json and applied consistently across all report pages.
Theme Colors (Core):
- Page Background (
#F5F7FA) - Page Outspace (
#E6E6E6) - Primary Text (
#1A1A1A) - Good / Positive (
#38B64B) - Bad / Negative (
#EE1C25) - Neutral (
#949599) - Table Accent (
#0052CC) - Center / Highlight (
#0B31A5)
Data Colors (Primary Palette):
- Blue (
#3366CC) · Red (#DC3912) · Orange (#FF9900) · Green (#109618) - Purple (
#990099) · Cyan (#0099C6) · Teal (#4AC5BB) · Yellow (#F4D25A)
Typography: Segoe UI — applied to all callout and title text classes.
Visual Borders: Rounded corners with transparent backgrounds for a clean card aesthetic.
👓 Am. Jandaghian