A payments analytics platform on synthetic Indian transaction data - Python ingestion, PostgreSQL medallion warehouse, dbt fraud-risk pipeline, governed KPI catalog, and a 7-page executive Power BI dashboard.
Focus: Fraud monitoring, merchant risk, velocity detection, and customer segmentation on a governed star schema and KPI catalog.







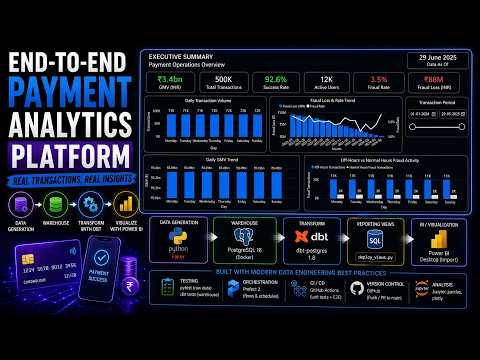
| Executive Summary | Transaction Overview |
|---|---|
 |
 |
| Fraud Risk Monitoring | Merchant Risk |
|---|---|
 |
 |
| Customer Analytics | Operations & Alerts |
|---|---|
 |
 |
- Video Walkthrough
- Dashboard Preview
- Business Problem
- Dashboard
- Key Business Insights
- Architecture
- Tech Stack
- Repository Structure
- Quick Start
- Pipeline Commands
- Testing
- Warehouse Layers
- Power BI Model
- Documentation
- Phase Completion
- Data Quality & Limitations
- Out of Scope
Payment platforms bleed revenue when teams cannot agree on the numbers - fraud loss in one spreadsheet, GMV in another, merchant risk in a third. Decisions slip; high-risk merchants and velocity spikes get reviewed too late.
| Pain today | What this platform delivers |
|---|---|
| No single source of truth for GMV, success, or fraud loss | Locked KPIs on one star schema - GMV ₹3.4Bn · Fraud ~3.5% · Success ~92.6% · Loss ~₹88M |
| Fraud ops blind to hour and category concentration | Off-hours (1-5 AM) and Travel/Electronics risk on Page 03 + hourly_fraud_trends |
| Merchant reviews biased by tiny sample sizes | is_rate_reliable guardrail before Top N on Page 04 |
| No prioritised velocity worklist | action_required queue on Page 06 from velocity_anomaly_detection |
| Customer risk and value viewed separately | fraud_customer_segments - fraud propensity × monetary tier on Page 05 |
| Metrics undocumented - every dashboard debate restarts | docs/kpi_definitions.md + layer dictionaries + pytest (raw QA) + dbt test (marts) |
Full context: docs/problem_statement.md
Power BI dashboard (Import mode from PostgreSQL).
| Page | Focus | Primary marts |
|---|---|---|
| 01 Executive Summary | Portfolio KPIs + validation | fct_transactions, daily_overview_kpis |
| 02 Transaction Overview | Volume, success, payment mix | fct_transactions |
| 03 Fraud Risk Monitoring | Hour × category fraud heatmap | fct_transactions, hourly_fraud_trends |
| 04 Merchant Risk | Review / suspend candidates | merchant_risk_profiling |
| 05 Customer Analytics | Segments (no retention trend chart) | fraud_customer_segments |
| 06 Operations & Alerts | Velocity ops queue | velocity_anomaly_detection |
| 07 Recommendations | Findings and synthetic limitations | - |
KPI cards: ~500K transactions · ₹3.4Bn GMV · ~92.6% success rate · ~3.5% fraud rate · ~₹88M fraud loss · GMV validation vs daily_overview_kpis. Month-over-month GMV and volume trends.
~463K successful transactions across UPI, cards, wallet, and netbanking rails. Status split (success / failed / declined), average ticket size, and payment-method share of volume.
Fraud concentrates in 1-5 AM off-hours and high-risk categories (Travel, Electronics). Hour × category heatmap from hourly_fraud_trends; risk-level and fraud_reason breakdown on fct_transactions.
~600 merchants ranked by fraud exposure - filter is_rate_reliable (≥50 txns) before Top N. ~12 seeded high-fraud merchants surface as review/suspend candidates; fraud_rate_pct null on long-tail low-volume merchants.
12,000 users segmented by RFM-style fraud_segment (Clean · Single Fraud · Repeat Fraudster); cohort_analysis mart retained for SQL depth.
Velocity ops queue from velocity_anomaly_detection - transactions breaching ≥5 txns / 1h or ≥15 txns / 24h thresholds. Prioritise rows with action_required = TRUE and highest velocity_score.
Headline findings, prioritised actions (off-hours monitoring, merchant review, velocity staffing), and honest synthetic limitations.

-
~₹88M fraud loss at ~3.5% fraud rate - fraud is a material drag on a ₹3.4Bn GMV base (~2.6% fraud-loss-to-GMV ratio). Executive KPIs reconcile between
fct_transactionsanddaily_overview_kpison Page 01. -
Off-hours fraud is structurally higher (1-5 AM) -
is_odd_hourandhourly_fraud_trendsjustify tightening overnight monitoring rules and staffing fraud ops for the early-morning window. -
Travel and Electronics merchants carry disproportionate risk -
is_high_risk_categoryand seeded high-fraud merchants make Page 04 the primary suspend/review workflow; always filteris_rate_reliableso long-tail merchants with <50 txns do not pollute rankings. -
Velocity spikes drive the ops queue - users hitting ≥5 transactions in 1 hour or ≥15 in 24 hours feed
velocity_anomaly_detection; Page 06 turns compositevelocity_scoreinto an actionableaction_requiredworklist. -
Customer value and fraud propensity must be segmented together -
fraud_customer_segmentsseparates Clean, Single Fraud, and Repeat Fraudster users against High/Medium/Low monetary tiers; retention trend charts were deliberately removed where synthetic data produced flat, misleading curves.
flowchart TB
  subgraph generate [Data Generation]
    Gen[transaction_generator.py]
    CSV[data/raw/*.csv]
  end
  subgraph ingest [Ingestion · PostgreSQL]
    DDL[create_raw_tables.py]
    Load[load_to_postgres.py]
    WM["raw.watermark<br/>ingestion high-water mark"]
    Raw["raw.users · merchants · transactions"]
  end
  subgraph warehouse [dbt Transform · PostgreSQL]
    Stg[staging views]
    Int[intermediate tables]
    Mart[marts tables]
  end
  subgraph publish [Reporting · PostgreSQL]
    Deploy[deploy_views.py]
    Rep[reporting.* views]
  end
  subgraph consume [Consumption]
    PBI[Power BI]
    Excel[Excel Export]
    NB[Jupyter EDA]
  end
  Gen --> CSV
  CSV --> Load
  DDL -.->|creates tables| Raw
  DDL -.->|creates table| WM
  WM -.->|last_loaded_ts| Load
  Load -->|insert / upsert| Raw
  Load -.->|update after load| WM
  Raw --> Stg --> Int --> Mart
  Mart --> Deploy --> Rep
  Mart --> PBI
  Rep --> PBI
  Mart --> Excel
  Rep --> Excel
  Mart --> NB
Design choices
- Ingestion watermark (
raw.watermark): Tracks source → raw load progress only (last_loaded_tsper table). Used byload_to_postgres.pyfor incremental transaction loads — not mart freshness. In production, mart rebuilds are driven by orchestration (make pipeline/ dbt), not this table. - Medallion-style layers:
raw→staging→intermediate→marts→reporting - Fraud intelligence in intermediate: composite score (0–100), velocity windows, explainable
fraud_reason - Slim fact table:
fct_transactionsomits hour columns; Power BI uses calc columnstxn_hour/txn_datefromtransaction_ts - Governed metrics:
docs/kpi_definitions.mdis the single KPI contract
| Layer | Technology |
|---|---|
| Data generation | Python, Faker |
| Warehouse | PostgreSQL 16 (Docker) |
| Transform | dbt-postgres 1.8 |
| Reporting views | SQL + deploy_views.py |
| BI | Power BI Desktop (Import) |
| Local workflow | Makefile - manual make targets; |
| Ingestion tests | pytest (make pytest) - raw CSV + raw.* tables |
| Warehouse tests | dbt schema tests (make test) - staging → marts |
| Orchestration | Prefect 2 - make prefect-run / make prefect-serve (.venv-orchestration) |
| CI/CD | GitHub Actions - unit tests + E2E (ingest · pytest · dbt) on push/PR to main |
| Analysis | Jupyter, pandas, plotly |
payment-transaction-analytics-platform/
├── docs/                  # Analytics platform documentation (dictionaries, KPIs, profiling)
├── generator/             # Synthetic users, merchants, transactions
├── ingestion/             # raw table DDL + CSV load + watermark
├── dbt/payment_dbt/       # Staging → intermediate → marts models
├── sql/                   # reporting.* view definitions
├── dashboard/screenshots/   # Power BI page previews
├── excel/                 # Excel workbook generator
├── notebooks/             # EDA notebooks (warehouse + fraud + segments)
├── tests/                 # pytest — ingestion / raw layer only
├── pytest.ini             # pytest config (testpaths, pythonpath)
├── .github/workflows/     # GitHub Actions CI (unit + E2E pipeline)
├── orchestration/         # Prefect flows (Makefile-driven pipeline)
├── docker-compose.yml     # PostgreSQL
├── Makefile
└── requirements.txt
- Python 3.11+
- Docker Desktop
make(Git Bash / WSL on Windows, or native on macOS/Linux)- Power BI Desktop (optional - view screenshots if not installed)
# 1. Clone and enter project
git clone <repository-url>
cd payment-transaction-analytics-platform

# 2. Virtual environment
python -m venv .venv
# Windows:  .venv\Scripts\activate
# macOS/Linux:  source .venv/bin/activate
pip install -r requirements.txt

# 3. Environment
cp .env.example .env
# Edit POSTGRES_PASSWORD in .env

# 4. dbt packages
make setup

# 5. Database
make up
make setup-db

# 6. Generate + load data
make ingest

# 6b. (Optional) Validate raw ingestion
make pytest

# 7. Transform + publish reporting views
make pipeline

# 7b. (Optional) Validate warehouse models
make test

# 8. (Optional) Prefect orchestration - required once per machine after clone
make prefect-setup
make prefect-run
# Details: orchestration/README.md- Open Power BI Desktop → Get Data → PostgreSQL
- Host
localhost, databasepayment_transaction_warehouse - Import tables from
martsschema - Add calculated columns on
fct_transactions:txn_hour,txn_datefromtransaction_ts
Metric definitions and formatting rules: docs/kpi_definitions.md
| Command | What it does |
|---|---|
make up |
Start PostgreSQL (Docker) |
make ingest |
Generate CSVs + incremental load into raw (upsert users/merchants, watermark txns) |
make pytest |
Run pytest - raw CSV + raw.* ingestion QA only |
make pipeline |
dbt build + deploy reporting.* views |
make test |
Run dbt warehouse tests only (SELECT=marts optional) |
make excel |
Export Excel workbook from marts |
make publish |
Deploy reporting.* views only |
make refresh |
Full rebuild - resets raw, re-ingests, re-runs pipeline |
make prefect-setup |
Create .venv-orchestration + install Prefect |
make prefect-run |
Run orchestrated flow once (up → ingest → pytest → pipeline → test) |
make prefect-serve |
Serve scheduled deployment (optional CRON="0 2 * * *") |
Orchestration details: orchestration/README.md
make build SELECT=velocity_anomaly_detection   # Single model
make docs                                       # dbt lineage docs
Full command reference: make help · dbt details: dbt/payment_dbt/README.md
Quality checks are split by layer - pytest does not run dbt tests.
| Command | Scope | When to run |
|---|---|---|
make pytest |
Raw CSV contracts + raw.* Postgres loads |
After make ingest |
make test |
dbt schema tests on staging → marts | After make pipeline or dbt build |
| Schema | Grain / role | Key outputs |
|---|---|---|
raw |
Source copy of CSVs | users, merchants, transactions |
staging |
1 row / transaction | stg_transactions - types, is_odd_hour, risky-category flags |
intermediate |
Fraud engine | int_transactions_enriched - score, velocity, fraud_reason |
marts |
BI-ready | Star schema + 8 analytics marts |
reporting |
Views on marts | *_ratio columns (0-1) for BI percentages |
Core star schema: dim_users · dim_merchants · fct_transactions
Analytics marts: daily_overview_kpis · daily_merchant_kpis · hourly_fraud_trends · merchant_risk_profiling · velocity_anomaly_detection · fraud_customer_segments · cohort_analysis · fraud_analysis_mart
Layer documentation: docs/README.md (read raw → staging → intermediate → marts)
| Topic | Detail |
|---|---|
| Relationships | Date → fct_transactions[transaction_ts] · dims → fact on user_sk / merchant_sk |
| Off-hours DAX | Filter PowerBI calc txn_hour IN {1,2,3,4,5} - not a warehouse column on fct_transactions |
| Merchant Top N | Filter is_rate_reliable = TRUE before ranking (fraud_rate_pct NULL when volume < 50) |
cohort_analysis |
Warehouse / SQL depth - mature retention logic, not dashboard chart |
| Percentages | Mart *_pct is 0-100 - divide by 100 in DAX or use reporting.* *_ratio |
This repo includes platform documentation under docs/:
| Document | Purpose |
|---|---|
problem_statement.md |
Business problem, stakeholders, success criteria |
initial_observation.md |
Profiling findings and known limitations |
kpi_definitions.md |
Metrics catalog (definitions + formulas) |
raw_data_dictionary.md |
Source schema |
staging_data_dictionary.md |
Feature flags and staging contracts |
intermediate_data_dictionary.md |
Fraud scoring engine |
marts_data_dictionary.md |
Mart tables + dashboard mapping |
Recommended reading order: problem statement → raw → staging → intermediate → marts → KPIs → initial observations
| Phase | Description | Status |
|---|---|---|
| Phase 1 | Synthetic data generation + PostgreSQL ingestion (raw layer) + pytest raw QA |
✅ Complete |
| Phase 2 | dbt warehouse - staging, intermediate fraud engine, marts + dbt tests | ✅ Complete |
| Phase 3 | reporting.* views + SQL analytics layer |
✅ Complete |
| Phase 4 | Jupyter EDA notebooks (fraud, segments, warehouse) | ✅ Complete |
| Phase 5 | Power BI dashboard - 7 pages, star schema, DAX measures | ✅ Complete |
| Phase 6 | Analytics platform documentation | ✅ Complete |
| Phase 7 | Workflow orchestration | ✅ Complete |
| Phase 8 | CI/CD — GitHub Actions (make pytest + make test on push) |
✅ Complete |
| Item | Handling |
|---|---|
| Synthetic data | Calibrated fraud ~3.5%; not real payment-rail behaviour |
| Small merchant volume | fraud_rate_pct NULL when < 50 txns - use is_rate_reliable |
| Exec validation | daily_overview_kpis cards isolated from dimension slicers |
| Raw CSVs | Gitignored - run make ingest after clone |
| KPI drift | Any make refresh requires re-validating dashboard + docs baselines |
Profiling detail: docs/initial_observation.md
- Live payment gateway ingestion
- Real-time streaming fraud scoring
Synthetic data only - no real customer or transaction data.