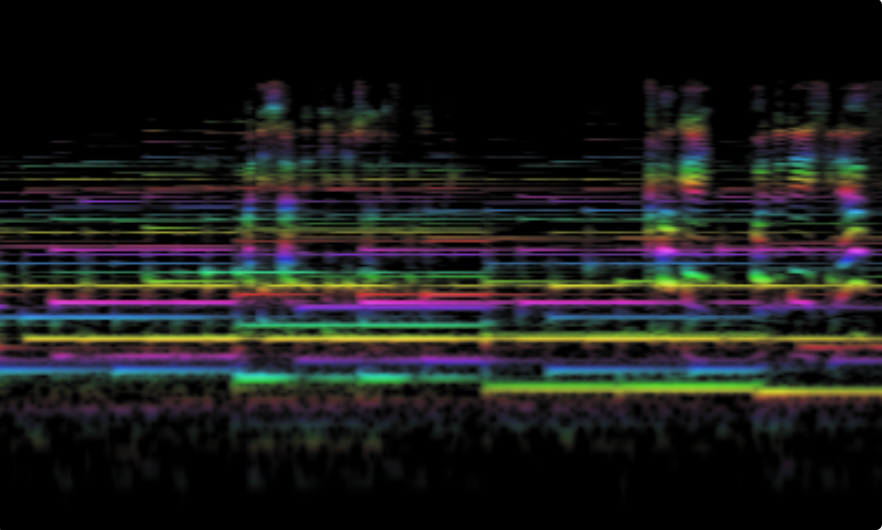
A zero-dependency, scientifically-grounded audio visualization tool built for musicians, researchers, and audio engineers. It bridges the gap between musical analysis (12-TET) and auditory perception (cochlear ERB bands), rendered as a highly crisp, colorized real-time spectrogram.
Features:
- Cochlear/Musical Hybrid Bands — Blends Constant-Q musical bands with Equivalent Rectangular Bandwidth (ERB) auditory filters, spanning A0 to C9.
- Perceptual dB Pipeline — Peak-picking FFT gathering and a unified perceptual loudness contour (+3dB pre-emphasis, formant lift, high roll-off) operating in logarithmic dB space.
- Lateral Inhibition — On-center/off-surround spectral sharpening mimics basilar membrane hair cells, separating overlapping harmonics.
- Fractional Smooth Scrolling — GPU sub-pixel interpolation and JS temporal frame interpolation allow speeds from 0.1x to 4x without smudging or stepping.
- Topographic Isobars — Algorithmic contour lines and a 5-tap unsharp mask in the WebGL2 fragment shader provide hyper-crisp, "Praat-style" visual definition.
- Display P3 support — Wider color gamut detection with saturation boost on supported displays.
- Recording & capture — High-quality video recording (VP9/Opus or H.264/AAC) and screenshot capabilities with seamless fractional-width handling.
- PWA support — Install as a standalone app, works offline.
- Zero external audio dependencies — Pure Web Audio API implementation.
The spectrogram uses the Web Audio API's AnalyserNode feeding a highly optimized WebGL2 ring buffer:
- FFT analysis — Raw frequency data captured via
getFloatFrequencyData(). - Hybrid Band Gathering — FFT bins are peak-picked into 10 sub-bands per semitone, blended between musical Constant-Q and cochlear ERB widths. Data is mapped to a 0..1 perceptual dB scale.
- Cochlear Processing — Lateral inhibition (spectral sharpening) and frequency-dependent temporal integration (fast treble, slow bass) are applied per frame.
- Texture upload — Band values are linearly interpolated between frames (if speed > 1) and written to a ring buffer texture.
- GPU Shader Processing — A 5-tap unsharp mask extracts edges. A unified perceptual contour balances the spectrum. Sigmoid contrast, topographic isobars, gamma lightness, and HSL color mapping finalize the image.
- Ring buffer scrolling — Seamless sub-pixel scrolling via float texture UV offset with
WRAP_T=REPEAT.
All heavy lifting is split between optimized typed-array math in JS and branchless math in the GPU fragment shader, ensuring maximum performance and scientific accuracy.
- FFT Size — 12-14 (4096-16384) — Higher values improve low-frequency resolution.
- Smooth — 0-1 — Temporal smoothing of the analyzer.
- Speed — 0.1-4 — Scrolling speed of the spectrogram. Fractional values stretch time; high speeds use temporal interpolation to prevent smearing.
- Midpoint — 0-1 — Sigmoid threshold for signal visibility.
- Steep — 3-40 — Sigmoid steepness for noise floor control.
(Hidden advanced controls include auditory filter blend, integration time constants, and sharpen lateral inhibition amounts).
- Vue 3 — Reactive UI framework
- Vite — Build tool and dev server
- UnoCSS — Utility-first CSS
- Web Audio API — Native browser audio processing (no external audio libraries)
- WebGL2 — GPU-accelerated rendering and custom fragment shaders
# Clone the repository
git clone https://github.com/chromatone/spectrogram.git
cd spectrogram

# Install dependencies
pnpm install

# Run development server
pnpm dev

# Build for production
pnpm build- Open the app in a modern browser
- Grant microphone access when prompted
- Adjust controls to fine-tune the visualization (midpoint ~0.25 and steep ~40 are great starting points)
- Use the camera button to capture screenshots
- Use the video button to record the spectrogram
- A0 — 27.5 Hz (lowest piano key)
- C9 — 15,870 Hz (highest piano key + 1 octave)
The spectrogram covers the full piano range plus one octave above, suitable for most musical and voice analysis.
MIT